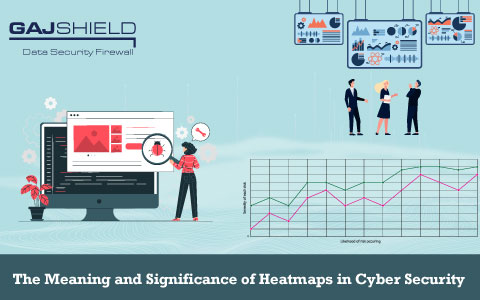
The Meaning and Significance of Heatmaps in Cyber Security
A heatmap graphically indicates cyber-risks in a data network. Tables and charts are used to interpret and derive meaning from them. There are individual colours in a matrix that denote the degree of risk that an organisation may be facing. Most organisations choose primary colours such as red in a heat map to indicate the highest level of risk, whereas yellow or green signify lower degrees of risk. Risk heat maps help present the cyber risk status of a data network in a visually attractive, concise and easy-to-comprehend format.

As heat maps are customised to insert heavy data sets to present them in a context that is simple to understand, they are regarded as a powerful visualisation tool in cybersecurity because it helps to identify and mitigate any risks.
How to Design a Heat Map
Creating a heat map is a vital stepping stone to bolstering your cybersecurity through this avenue. Here are some steps to design a data security heat map:
Identifying Risks
The most crucial step in designing a heat map is identifying the risks associated with your organisation. A comprehensive risk analysis should be conducted before creating a heat map.
Examining Risks
Once the organisation has identified its risks, the next step is to understand the severity of it and the likelihood of each threat occurring and hampering their data and cybersecurity. These two components are essential to execute the process of ranking the risk and creating an effective graph. The final rank will be dependent on the amount of risk a company is willing to endure to achieve its goals.
Mapping Risks
The next step is to plot the risks based on the rank assigned to them. Either the companies can use excel or computer programs to design the map, or they can render it manually. The map contains two axes. One axis represents the severity of each risk, and the other axis represents the likelihood of it occurring. The customised colours representing the severity of risks are integrated into the map after locating the critical areas.
Monitoring and Updating
A heat map is not a fixed program. As and when the organisation grows or expands, the representation of the map will also change accordingly. Therefore businesses should annually revisit the heat map and adjust it according to the risks, their ranking and efforts taken to mitigate them.
What is the Significance of Heat Maps?
Here are some of the prominent positives of heat maps in data security. Apart from these, there are several more benefits too.
Helps in Strategic Decisions
A heat map helps to provide a holistic view of all the areas in an organisation that are under threat and also shows the severity of it. This enables firms to understand which functions are under the biggest threat and then helps to come up with strategic decisions to mitigate them.
Improves Risk Management
Heat maps provide an enhanced risk management framework. By denoting which function of the organisation is under the biggest threat, maps can alert the team to take necessary actions. It also helps to keep an eye on the company's risk management process.
Increases Focus on Risk Tolerance and Appetite
A heatmap is built on the organisation's risk management framework. Risk appetite means the extent of risk an organisation is willing to take to meet its objective. Risk tolerance refers to the acceptable deviation from the firm's risk appetite. Therefore an organisation's risk appetite and risk tolerance need to be measured so as to provide more accurate results of the risks the company can endure or mitigate.
Enhances Precision in the Risk Mitigation process
Heat maps allow businesses to implement more precise risk management and risk mitigation processes by denoting the severity and likelihood of a threat disrupting the company's procedures. It alerts the company as to which area needs more protection and safeguards it against threats.
Increases Collaboration
The heat maps provide a visual representation of the different levels of threat across all an organisation's functions and give greater risk visibility. This enables the security team to come up with a comprehensive strategy to mitigate any threats to the different departments of the firm and safeguard all processes from cyber threats.
In a very challenging cyber environment, heat maps present complex sets of data in a straightforward way. This helps organisations to build cyber resilience. Designing a heat map nudges the teams to locate any risks that could endanger the business and rank them on the degree of their impact and likelihood. This enables the company to prioritise the areas under maximum threat and come up with strategies to mitigate them. Cybercriminals will continue to attack, which is damaging and evasive to the firm's security. Risk heat maps will provide holistic cyber security solutions that will examine a company's cyber-health and locate, evaluate and evade cybersecurity vulnerabilities and threats. They help in making stronger decisions than traditional business intelligence is unable to do.
You need the best cybersecurity solutions to maintain business continuity and prevent the threat of malicious threats. Gajshield’s data security solutions, such as context-aware access control tools and intelligent firewalls, can help you achieve this objective.
Kindly contact us to delve deeper into our list of data security solutions.
Get In Touch With Us
Subscribe to our Newsletter
2025 © GajShield Infotech (I) Pvt. Ltd. All rights reserved.
